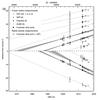
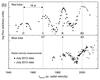
Fig. 2
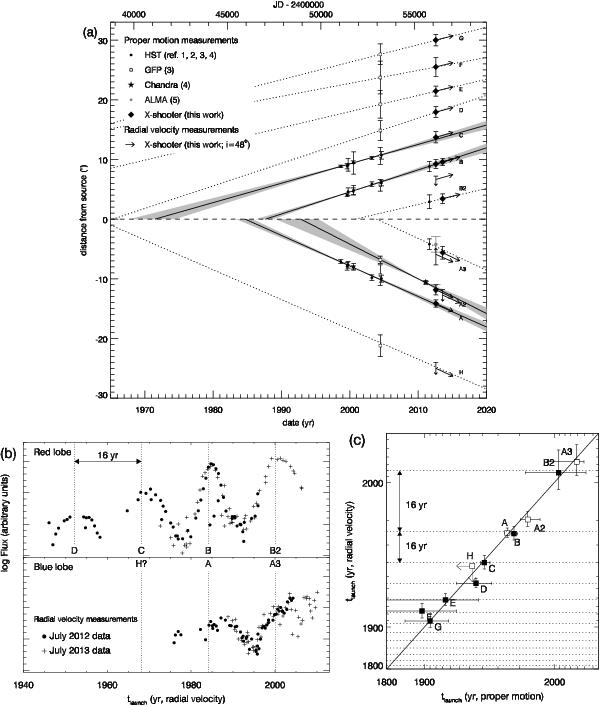
a) Positions of the knots of HH 409 over time; vertical bars correspond to the FWHM of the spatial profile. The shaded bands and dashed lines are linear fits to their trajectories. The arrows represent the velocities on the sky calculated from the radial velocities and disk inclination. References: (1) Devine et al. (2000); (2) Grady et al. (2000); (3) Wassell et al. (2006); (4) Günther et al. (2013); (5) Klaassen et al. (2013). b) Launch epochs from radial velocities in the X-shooter spectra. Every symbol represents the flux (on a logarithmic scale) and tlaunch of one row of the two-dimensional spectrum, obtained through the procedure described in the text. Only peaks above the 3σ background level are displayed. The data show a periodicity of 16 yr, which was also obtained from the global fit to the jet proper motions (dotted lines). The launch epochs also agree well between the blue and red lobes. c) Launch epochs of knots in the blue (open squares) and red (closed squares) lobes, derived from proper motions and from radial velocities. The dotted horizontal lines are plotted on a 16-year interval; note the logarithmic scale.
Current usage metrics show cumulative count of Article Views (full-text article views including HTML views, PDF and ePub downloads, according to the available data) and Abstracts Views on Vision4Press platform.
Data correspond to usage on the plateform after 2015. The current usage metrics is available 48-96 hours after online publication and is updated daily on week days.
Initial download of the metrics may take a while.