Fig. 1
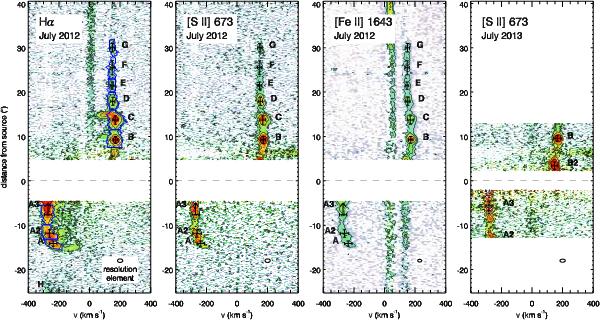
Position-velocity diagram of Hα, [S ii] λ673 nm, and [Fe ii] λ1643 nm in July 2012, and [S ii] λ673 nm in July 2013. The y-axis denotes the position along the slit; y > 0 corresponds to the NE lobe, while y < 0 corresponds to the SW lobe. Due to the brightness of the source, the central region was not observed. Black contours correspond to log Fλ/ [erg s-1 cm-2Å-1] = (−17.5, −17, −16.5, −16, −15.5). The blue contours indicate the 3σ detection level of the knots. The black crosses denote the derived positions and velocities of the knots, and their 1σ uncertainties. Note the bow shock features in knot A and C in Hα.
Current usage metrics show cumulative count of Article Views (full-text article views including HTML views, PDF and ePub downloads, according to the available data) and Abstracts Views on Vision4Press platform.
Data correspond to usage on the plateform after 2015. The current usage metrics is available 48-96 hours after online publication and is updated daily on week days.
Initial download of the metrics may take a while.