Fig. 4
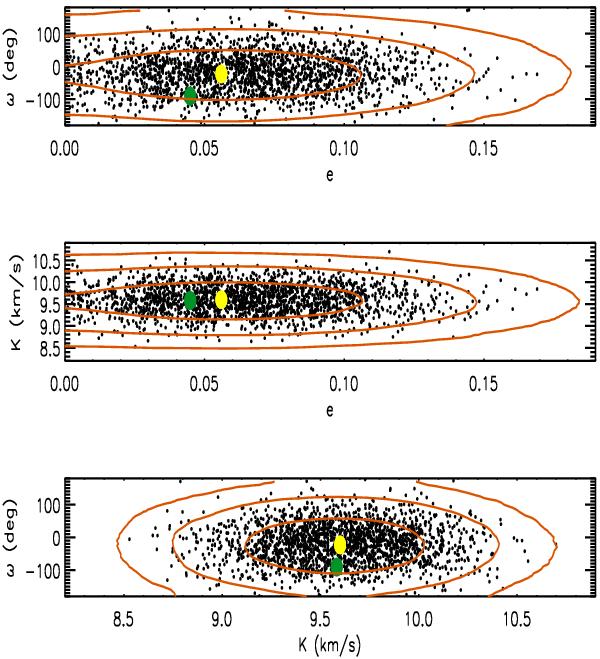
Upper panel: two-dimensional a posteriori distribution of the argument of periastron ω vs. the eccentricity e as obtained with the MCMC method. The yellow filled circle corresponds to the best-fit orbital solution of Johnson et al. (2011), while the green circle indicates our best-fit values of the parameters. The orange level lines enclose 68.2, 95, and 99.7 per cent of the distribution, respectively. Individual points of the MCMC have been plotted after applying a thinning factor of 100 to the chain for clarity. Middle panel: as upper panel, but for the radial velocity semi-amplitude K and the eccentricity e. Lower panel: as upper panel, but for the argument of periastron ω and the radial velocity semi-amplitude K.
Current usage metrics show cumulative count of Article Views (full-text article views including HTML views, PDF and ePub downloads, according to the available data) and Abstracts Views on Vision4Press platform.
Data correspond to usage on the plateform after 2015. The current usage metrics is available 48-96 hours after online publication and is updated daily on week days.
Initial download of the metrics may take a while.