Fig. 3
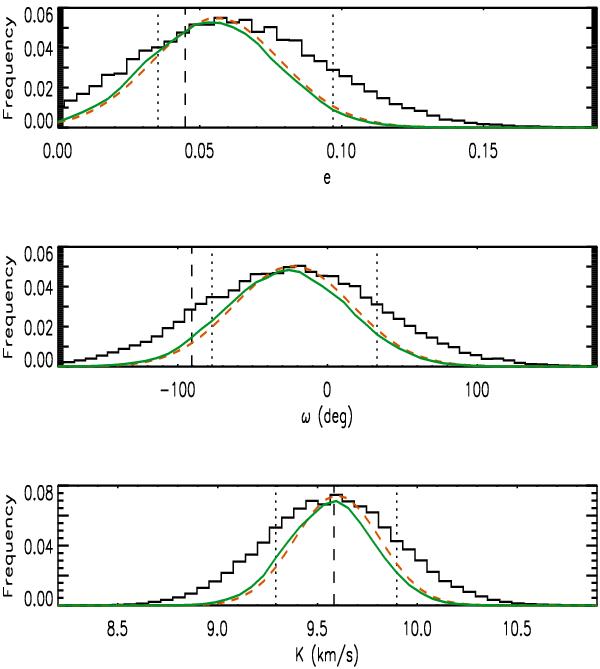
Top panel: a posteriori distribution of eccentricity e as obtained with our MCMC approach. The vertical dashed line indicates the value corresponding to the best fit plotted in Fig. 2, while the two vertical dotted lines enclose an interval between 15.9 and 84.1 per cent of the distribution. The solid green line is the mean likelihood as computed by means of Eq. (A4) of Sajina et al. (2006), while the dashed orange line is the prior assumed for the parameter. These two distributions have been normalized to the maximum of the a posteriori distribution of the eccentricity. Note that the two distributions are very similar, indicating that fitting Doppler-beaming does not add much constraint to the eccentricity. Middle panel: as upper panel, but for the argument of periastron ω. Lower panel: as upper panel, but for the semi-amplitude of the radial velocity modulation K.
Current usage metrics show cumulative count of Article Views (full-text article views including HTML views, PDF and ePub downloads, according to the available data) and Abstracts Views on Vision4Press platform.
Data correspond to usage on the plateform after 2015. The current usage metrics is available 48-96 hours after online publication and is updated daily on week days.
Initial download of the metrics may take a while.