Fig. 2
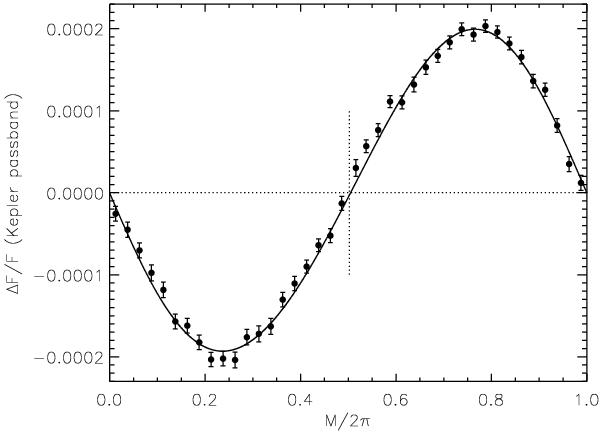
Relative flux variation of LHS 6343 A vs. the mean anomaly M of the orbit, binned in 40 equal intervals. The Doppler-beaming plus ellipsoidal effect model for our best-fitting parameters is plotted with a solid line (cf. the text). The value of M/2π corresponding to mid-eclipse is marked with a dotted vertical segment, while a horizontal dotted line is plotted to indicate the zero-flux level.
Current usage metrics show cumulative count of Article Views (full-text article views including HTML views, PDF and ePub downloads, according to the available data) and Abstracts Views on Vision4Press platform.
Data correspond to usage on the plateform after 2015. The current usage metrics is available 48-96 hours after online publication and is updated daily on week days.
Initial download of the metrics may take a while.