Fig. 6
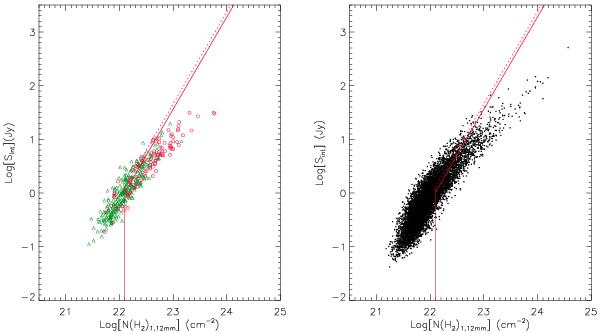
Left panel: logarithm of the integrated flux density versus beam-averaged H2 column density of BGPS sources with and without class II methanol maser detections (marked by red circles and green triangles, respectively) in our current sample. The solid lines mark the boundary defined by Chen et al. (2012), while the dotted lines mark the slightly revised boundary. Right panel: same as left panel, but for all BGPS sources.
Current usage metrics show cumulative count of Article Views (full-text article views including HTML views, PDF and ePub downloads, according to the available data) and Abstracts Views on Vision4Press platform.
Data correspond to usage on the plateform after 2015. The current usage metrics is available 48-96 hours after online publication and is updated daily on week days.
Initial download of the metrics may take a while.