Fig. 5
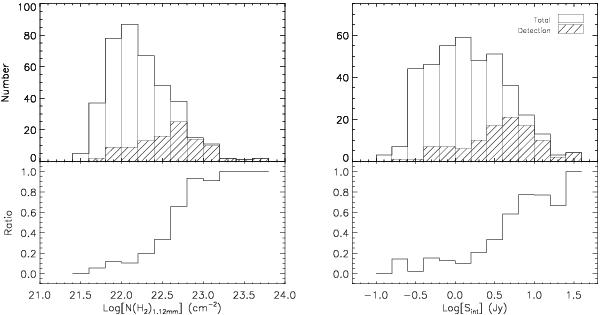
Detection rates of class II methanol masers versus the BGPS beam-averaged H2 column density (left), and integrated flux density of the BGPS sources (right). For each BGPS property, the upper panel shows the histogram distributions of total sample sources (blank) and detected 6.7 GHz class II methanol maser sources (hatched), and the lower panel shows the corresponding detection rate of class II methanol maser in each statistical bin.
Current usage metrics show cumulative count of Article Views (full-text article views including HTML views, PDF and ePub downloads, according to the available data) and Abstracts Views on Vision4Press platform.
Data correspond to usage on the plateform after 2015. The current usage metrics is available 48-96 hours after online publication and is updated daily on week days.
Initial download of the metrics may take a while.