Fig. 4
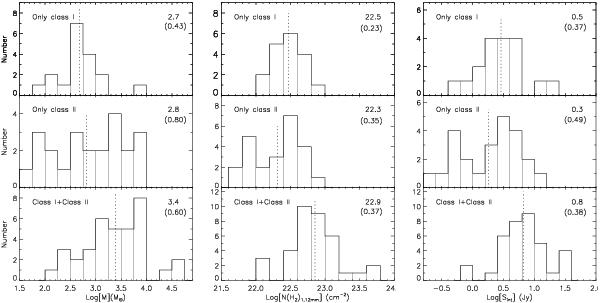
Distributions of mass (left), beam-averaged H2 column density (middle), and 1.1 mm integrated flux density of the BGPS sources (right) for the three subgroups with only class I or class II detections and with both class I and class II detections. Together with the standard deviation, the mean value is marked and indicated by a dotted line in each plot.
Current usage metrics show cumulative count of Article Views (full-text article views including HTML views, PDF and ePub downloads, according to the available data) and Abstracts Views on Vision4Press platform.
Data correspond to usage on the plateform after 2015. The current usage metrics is available 48-96 hours after online publication and is updated daily on week days.
Initial download of the metrics may take a while.