Fig. 1
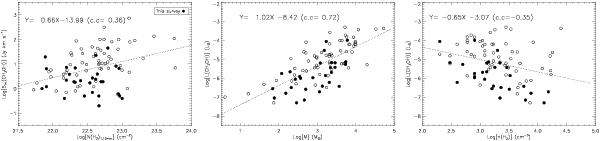
Correlations between 6.7 GHz integrated flux density and beam-averaged H2 column density (left), between 6.7 GHz luminosity and mass (middle), and between 6.7 GHz luminosity and H2 volume density (right) of the associated 1.1 mm BGPS sources in the log-log plot. The dotted line in each panel represents the least-squares fit result to all data points. The correlation coefficient is also marked in each plot. Properties of the 6.7 GHz methanol masers are based on both this current survey and the literature (e.g., Caswell et al. 2010; Green et al. 2010; Szymczak et al. 2012), which are indicated by filled and open circles, respectively.
Current usage metrics show cumulative count of Article Views (full-text article views including HTML views, PDF and ePub downloads, according to the available data) and Abstracts Views on Vision4Press platform.
Data correspond to usage on the plateform after 2015. The current usage metrics is available 48-96 hours after online publication and is updated daily on week days.
Initial download of the metrics may take a while.