Fig. 4
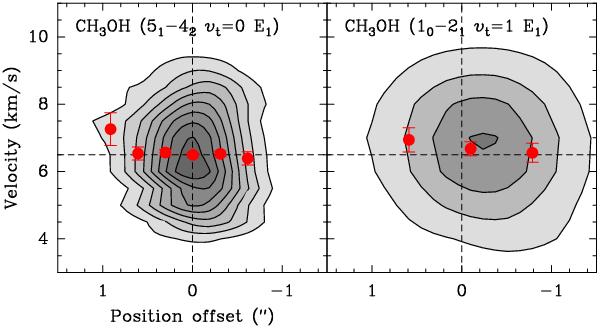
Position-velocity diagrams for the 1 mm (left panel) and 3 mm (right panel) methanol lines. The contour spacing is 50 mJy beam-1 (2.4σ) and 10 mJy beam-1 (2σ) for the 1 mm and 3 mm methanol lines, respectively. The red points with error bars show the first order moment measured at each position offset. The horizontal dashed line shows the source vLSR (6.5 km s-1). The vertical dashed lines indicate the center of the cut.
Current usage metrics show cumulative count of Article Views (full-text article views including HTML views, PDF and ePub downloads, according to the available data) and Abstracts Views on Vision4Press platform.
Data correspond to usage on the plateform after 2015. The current usage metrics is available 48-96 hours after online publication and is updated daily on week days.
Initial download of the metrics may take a while.