Fig. 3
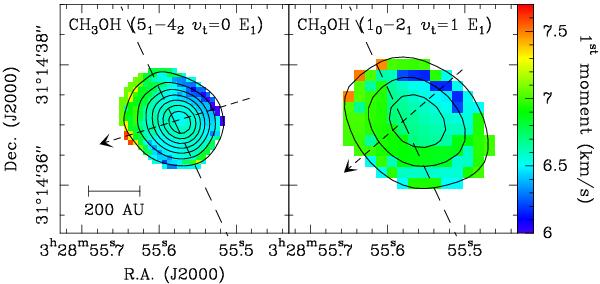
First-order moment maps of the 1 mm (left panel) and 3 mm (right panel) methanol lines. In each panel the solid contours show the velocity integrated line intensity. The contour spacings are 200 mJy beam-1 km s-1 and 20 mJy beam-1 km s-1 for the 1 mm and 3 mm methanol lines, respectively. The dashed line shows the orientation of the outflow, while the dashed arrow indicates the orientation of the velocity gradient as determined from the first-order moment fit (see Sect. 3). The line and arrow intersect at the position of MM1.
Current usage metrics show cumulative count of Article Views (full-text article views including HTML views, PDF and ePub downloads, according to the available data) and Abstracts Views on Vision4Press platform.
Data correspond to usage on the plateform after 2015. The current usage metrics is available 48-96 hours after online publication and is updated daily on week days.
Initial download of the metrics may take a while.