Fig. 2
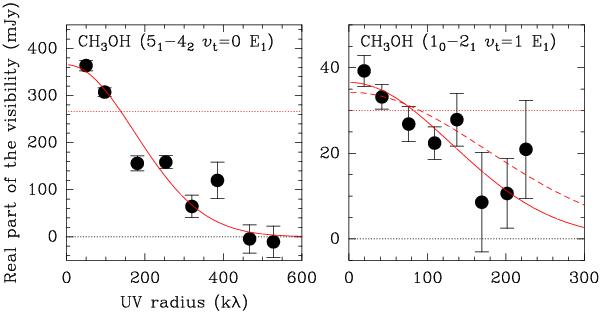
Real part of the visibility of the 1 mm (left panel) and 3 mm (right panel) methanol lines as a function of the UV radius (black points with error bars). The visibilities have been averaged over the line profile, and then averaged circularly. The solid red line in each panel shows the result of a Gaussian source fit, while the dotted red line shows the result of a point source fit. The dashed line in the right panel shows the result of a Gaussian source fit with a FWHM size fixed to that of the 1 mm line (0.44″). The dotted black line in each panel indicates the zero level.
Current usage metrics show cumulative count of Article Views (full-text article views including HTML views, PDF and ePub downloads, according to the available data) and Abstracts Views on Vision4Press platform.
Data correspond to usage on the plateform after 2015. The current usage metrics is available 48-96 hours after online publication and is updated daily on week days.
Initial download of the metrics may take a while.