Fig. 1
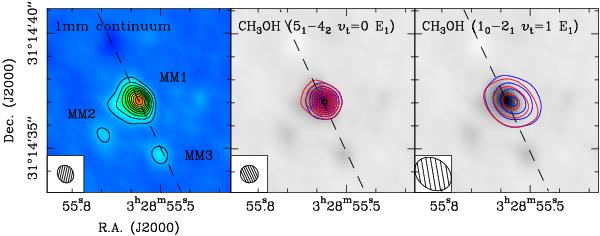
Continuum and line emissions observed towards IRAS2A with the PdBI. The left panel shows the 1 mm continuum emission. Contour spacing is 10 mJy beam-1 (6.6σ). The other panels show the velocity integrated intensities of the 1 mm and 3 mm methanol lines (blue and red contours) together with the continuum (grayscale image). The blue and red contours correspond to velocities <6.5 km s-1 and >6.5 km s-1, respectively. In the center panel, the blue and red contours are almost coincident. The contour spacings are 100 mJy beam-1 km s-1 (3.2σ) and 30 mJy beam-1 km s-1 (2.1σ) for the 1 mm and 3 mm lines, respectively. In each panel the dashed ellipse indicates the size and orientation of the synthesized beam. The dashed line shows the orientation of the outflow (which has a PA of 25°; Codella et al. 2014).
Current usage metrics show cumulative count of Article Views (full-text article views including HTML views, PDF and ePub downloads, according to the available data) and Abstracts Views on Vision4Press platform.
Data correspond to usage on the plateform after 2015. The current usage metrics is available 48-96 hours after online publication and is updated daily on week days.
Initial download of the metrics may take a while.