Fig. 2
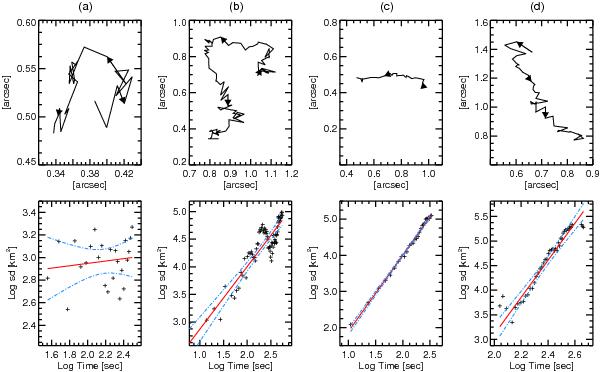
Trajectories (top) and log-log plots of the squared displacement (sd) vs. time (bottom) of the four MBPs (a)–d)) identified in Fig. 1, marked at the top of the upper panels. Arrows on the trajectories indicate the direction of the MBPs’ motion. The red solid lines are the best linear fits to the sd data points (crosses) vs. time and the blue dot-dashed lines show the 95% confidence bands around the linear fit. The linear fits result in a) a MBP with γ = 0.10 ± 0.47, b) a slope (or γ) of 1.13 ± 0.18, c) a MBP with γ = 2.10 ± 0.11, and d) a MBP with a high power exponent γ of 3.76 ± 0.57. The uncertainties are computed from the 95% confidence bands.
Current usage metrics show cumulative count of Article Views (full-text article views including HTML views, PDF and ePub downloads, according to the available data) and Abstracts Views on Vision4Press platform.
Data correspond to usage on the plateform after 2015. The current usage metrics is available 48-96 hours after online publication and is updated daily on week days.
Initial download of the metrics may take a while.