Fig. C.1
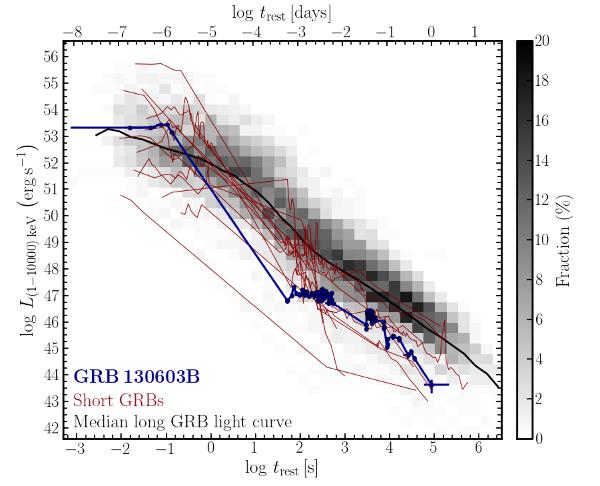
Pseudo-bolometric light curve evolution of Swift GRBs from the prompt to the afterglow phase. The density plot was built from over 280 long GRBs with redshift information. Its median light curve is shown in black. Overplotted are in red the 13 short GRBs from Table C.1 and in dark blue GRB 130603B. X-ray data sets naturally have orbit gaps. To correct for this, we estimate the luminosity of long GRBs at missing grid points by interpolating between adjacent data points.
Current usage metrics show cumulative count of Article Views (full-text article views including HTML views, PDF and ePub downloads, according to the available data) and Abstracts Views on Vision4Press platform.
Data correspond to usage on the plateform after 2015. The current usage metrics is available 48-96 hours after online publication and is updated daily on week days.
Initial download of the metrics may take a while.