Free Access
Fig. 1
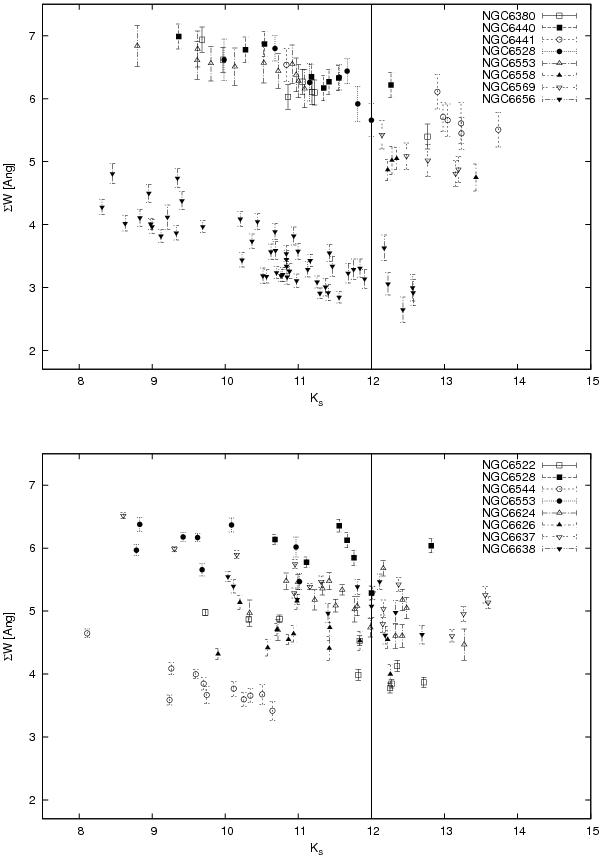
Ca II line strength plotted against Ks magnitude for VVV clusters in S12 and R97 catalogs. The vertical bold line at Ks = 12 is the saturation limit for the VVV survey. Vertical bars on each point show the measurement uncertainty in the line strengths. The measurement uncertainty in magnitude is too small to be noticed.
This figure is made of several images, please see below:
Current usage metrics show cumulative count of Article Views (full-text article views including HTML views, PDF and ePub downloads, according to the available data) and Abstracts Views on Vision4Press platform.
Data correspond to usage on the plateform after 2015. The current usage metrics is available 48-96 hours after online publication and is updated daily on week days.
Initial download of the metrics may take a while.