Fig. 5
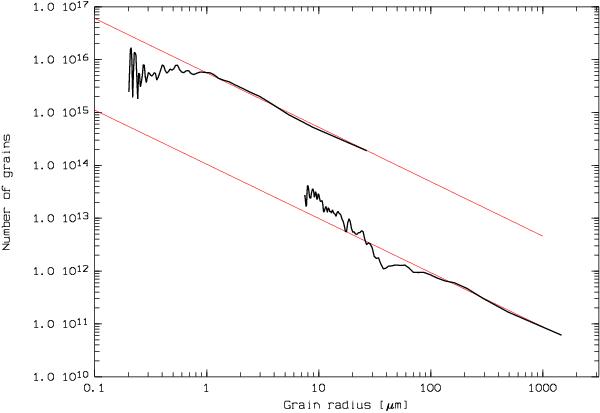
Dust grain distribution (thick line) measured along streamers B (bottom) and C (top). The conversion from β to grain size assumed ρ = 3000 kg m-2. In both cases, the left end of the distribution is affected by the low S/N in the outskirt of the tail; the right end of the distribution was truncated when reaching the seeing disk of the nucleus. The narrow lines are linear fits to the distributions where they are not affected by the noise.
Current usage metrics show cumulative count of Article Views (full-text article views including HTML views, PDF and ePub downloads, according to the available data) and Abstracts Views on Vision4Press platform.
Data correspond to usage on the plateform after 2015. The current usage metrics is available 48-96 hours after online publication and is updated daily on week days.
Initial download of the metrics may take a while.