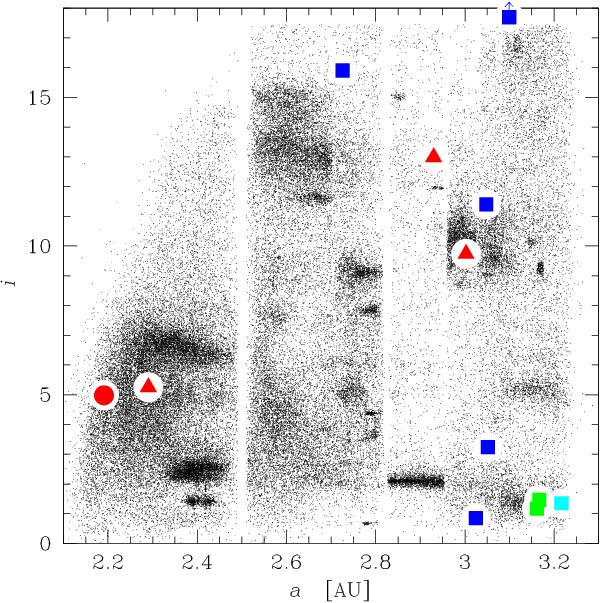
Fig. 1

Orbital elements (inclination vs. semi-major axis) of objects in the asteroid main belt. The small dots represent the background population of main belt asteroids (only numbered ones are represented for clarity; proper elements were used to put collisional families in evidence as dense clouds; source: the Asteroid Dynamics Site, http://hamilton.dm.unipi.it/astdys/). The known main belt comets are represented as large symbols: squares indicate objects with extended activity; those that showed activity at more than one perihelion are plotted in green; 176P, which did not display activity when returning to perihelion, is marked in cyan. The inclination of P/2010 R2 is off scale (i = 21.39); its a is marked by a square with an arrow at the top of the plot. Triangles indicate objects that showed only a very brief activity episode. P5 is indicated by the large red circle to the left.
Current usage metrics show cumulative count of Article Views (full-text article views including HTML views, PDF and ePub downloads, according to the available data) and Abstracts Views on Vision4Press platform.
Data correspond to usage on the plateform after 2015. The current usage metrics is available 48-96 hours after online publication and is updated daily on week days.
Initial download of the metrics may take a while.


