Fig. 6
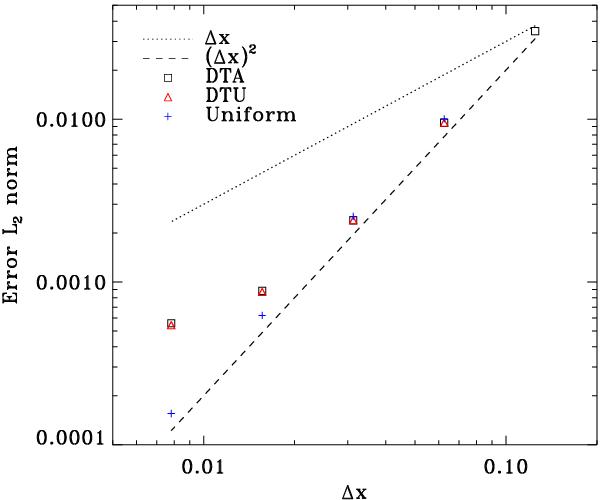
L2 norm of the error as a function of the minimum grid size for the three models: DTA (black square), DTU (red triangle), and uniform resolution (blue cross). The dotted line gives the slope that is proportional to Δx (first-order accuracy in space) and the dashed line the (Δx)2 slope (expected second-order accuracy).
Current usage metrics show cumulative count of Article Views (full-text article views including HTML views, PDF and ePub downloads, according to the available data) and Abstracts Views on Vision4Press platform.
Data correspond to usage on the plateform after 2015. The current usage metrics is available 48-96 hours after online publication and is updated daily on week days.
Initial download of the metrics may take a while.