Fig. 5
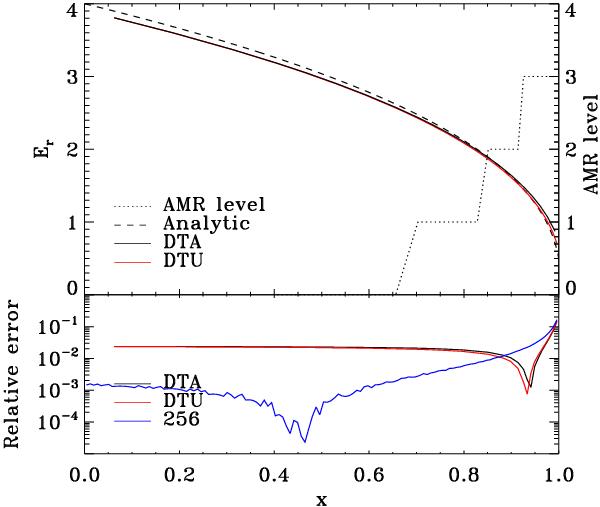
Equilibrium test with nonlinear diffusion coefficient. Top: radiative energy profile for the DTA (adaptive time step, black) and DTU (unique time step, red) models, and for the stationary analytic solution (dashed line). The right axis indicates the AMR levels of the DTA and DTU models (dotted line). Bottom: relative error profiles for the DTA (black), DTU (red) and uniform grid (256 cells, blue) models.
Current usage metrics show cumulative count of Article Views (full-text article views including HTML views, PDF and ePub downloads, according to the available data) and Abstracts Views on Vision4Press platform.
Data correspond to usage on the plateform after 2015. The current usage metrics is available 48-96 hours after online publication and is updated daily on week days.
Initial download of the metrics may take a while.