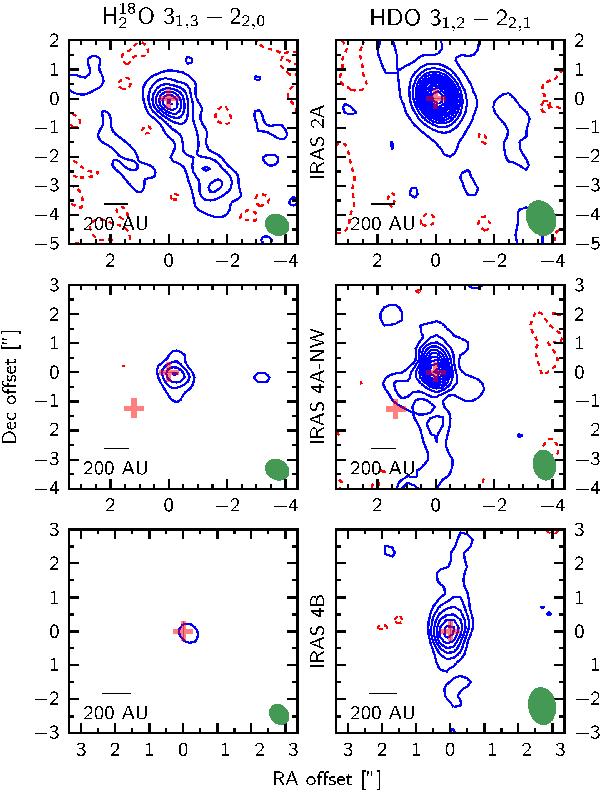
Fig. 3
Integrated intensity maps for the HDO 31,1 − 33,1 and H O 31,3 − 22,0 in the interval vline ± FWHM toward all three sources. The beam is shown in the lower right corner and the red crosses show the position of continuum peaks. Contours start at 41.1 mJy km s-1 (5σ steps for HO and 20σ for HDO) for IRAS 2A, 50.1 mJy km s-1 (2σ steps) for IRAS 4A, and 29.8 mJy km s-1 (2σ steps) for IRAS 4B, dashed contours represent negative values.
Current usage metrics show cumulative count of Article Views (full-text article views including HTML views, PDF and ePub downloads, according to the available data) and Abstracts Views on Vision4Press platform.
Data correspond to usage on the plateform after 2015. The current usage metrics is available 48-96 hours after online publication and is updated daily on week days.
Initial download of the metrics may take a while.