Free Access
Fig. 2
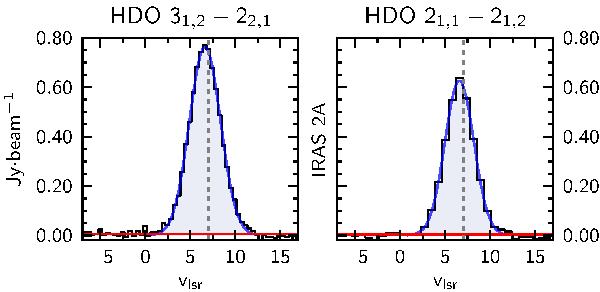
Continuum subtracted spectra of the HDO 31,2 − 22,1 (225 GHz) and 21,1 − 21,2 (241 GHz) lines toward IRAS2A. The parental cloud velocity is shown by the dotted line (vlsr = 7 km s-1) and the Gaussian fits (blue) to the HDO lines are plotted along with the RMS (red).
Current usage metrics show cumulative count of Article Views (full-text article views including HTML views, PDF and ePub downloads, according to the available data) and Abstracts Views on Vision4Press platform.
Data correspond to usage on the plateform after 2015. The current usage metrics is available 48-96 hours after online publication and is updated daily on week days.
Initial download of the metrics may take a while.