Fig. 1
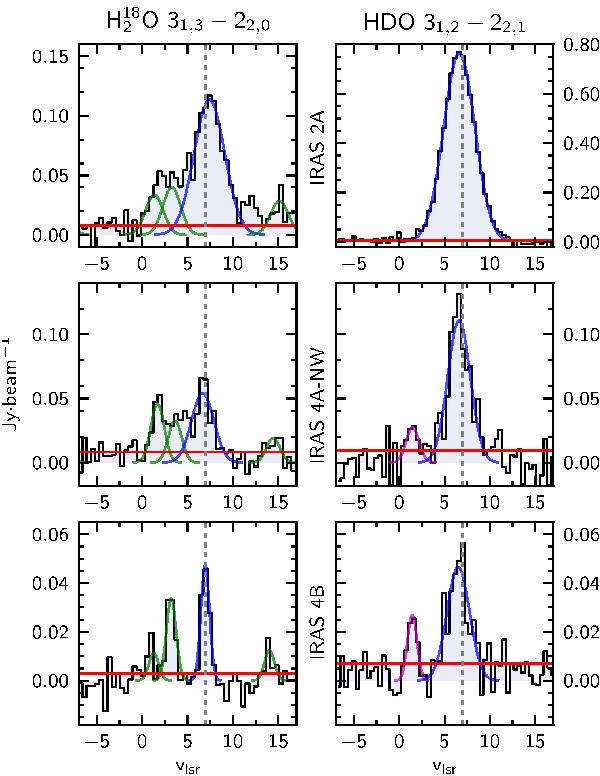
Continuum subtracted spectra of the H O 31,3 − 22,0 and HDO 31,2 − 22,1 lines toward the three sources NGC-1333 IRAS 2A, IRAS 4A-NW, and IRAS 4B. The HO spectra are from Jørgensen & van Dishoeck (2010a) and Persson et al. (2012). The green lines shows the CH3OCH3, and blue HO. In some of the HDO spectra (bottom two), a second line can be seen (magenta) at 1.5 km s-1, this is from CH3OCHO. The parental cloud velocity is shown by the dotted line (vlsr = 7 km s-1) and the Gaussian fits (green, magenta, and blue) to the lines are plotted along with the RMS (red). We note the different scales of the spectra toward IRAS 2A.
Current usage metrics show cumulative count of Article Views (full-text article views including HTML views, PDF and ePub downloads, according to the available data) and Abstracts Views on Vision4Press platform.
Data correspond to usage on the plateform after 2015. The current usage metrics is available 48-96 hours after online publication and is updated daily on week days.
Initial download of the metrics may take a while.