Free Access
Fig. 6
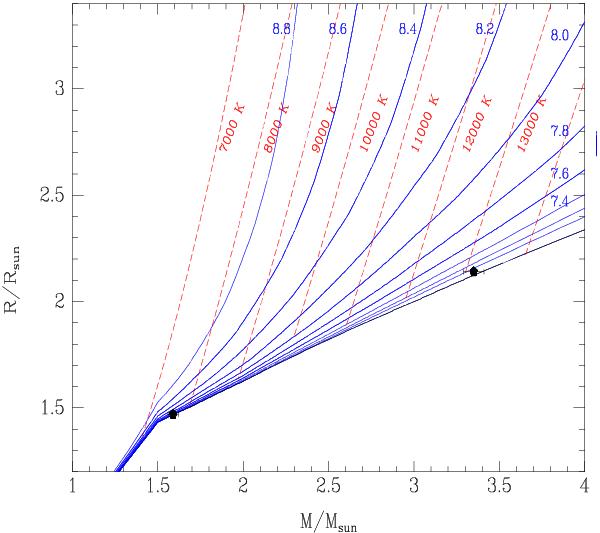
Mass-radius diagram of the subsystem WDS 08263–3904 Aab. Filled circles with error bars represent the components, whose positions are compared with the models of Lejeune & Schaerer (2001) for solar composition. Isochrones corresponding to log τ = 6.5 and log τ = 7.0 are plotted in continuous and dashed lines, respectively.
Current usage metrics show cumulative count of Article Views (full-text article views including HTML views, PDF and ePub downloads, according to the available data) and Abstracts Views on Vision4Press platform.
Data correspond to usage on the plateform after 2015. The current usage metrics is available 48-96 hours after online publication and is updated daily on week days.
Initial download of the metrics may take a while.