Fig. 12
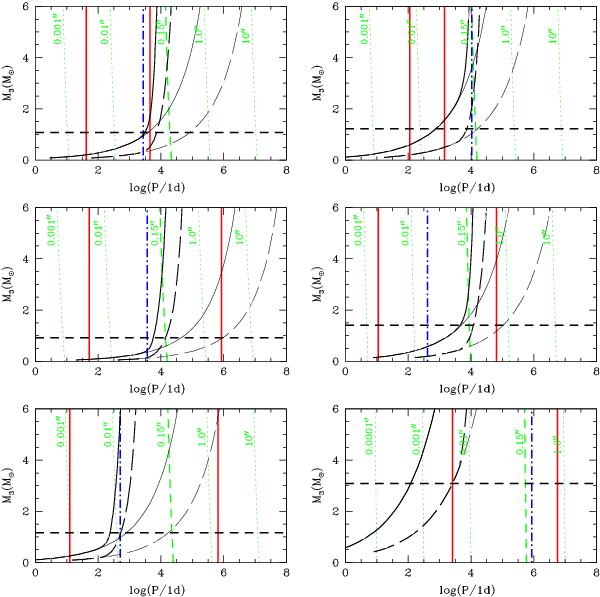
Detection limits of intermediate orbits for the systems WDS 05247–5219 (top left), WDS 16054–1948 (top right), WDS 04352–0944 (middle left), WDS 08563–5243 (middle right), WDS 08263–3904 (bottom left), and WDS 17301–3343 (bottom right). Thick red vertical continuous lines delimit the range of possible periods for the intermediate orbit to maintain the stability of the system. The thick blue vertical dot-dashed line represents the upper limit for Pout for the existence of Kozai cycles (Pout(yr) ≲ [Pin(days)] 1.4). Thick black continuous and long-dashed curves indicate detection probabilities of 95% and 50%, respectively. The corresponding thin lines represent detection probabilities of 95% and 50% that would be achieved if we extend the time baseline of the observations indefinitely. Thin green dotted lines are references to the angular separations that would have the components for some periods, considering the parallax of the system. Thick black vertical and horizontal dashed lines indicate a separation of ρ = 0.15′′ and the mass of the third body corresponding to a magnitude difference Δm = 4 with the spectroscopic subsystem (see explanation in the text).
Current usage metrics show cumulative count of Article Views (full-text article views including HTML views, PDF and ePub downloads, according to the available data) and Abstracts Views on Vision4Press platform.
Data correspond to usage on the plateform after 2015. The current usage metrics is available 48-96 hours after online publication and is updated daily on week days.
Initial download of the metrics may take a while.