Fig. 11
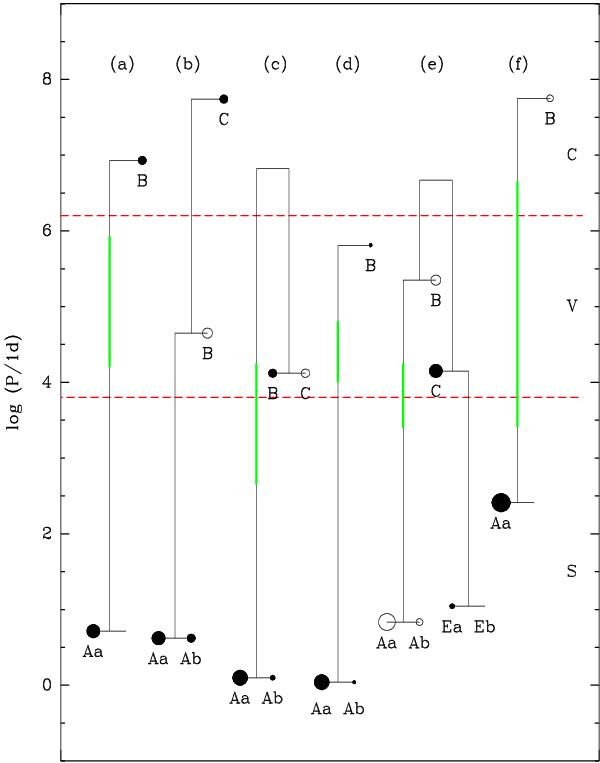
Configuration of the analysed multiple systems: a) WDS 04352–0944, b) WDS 05247–5219, c) WDS 08263–3904, d) WDS 08563–5243, e) WDS 16054–1948, and f) WDS 17301–3343. Stellar components are represented by circles. Filled circles are stars observed in the present paper. No symbol is plotted for stellar components that are not visible in the spectrum (secondaries of SB1 systems). Dashed lines divide approximately the period axis in spectroscopic (S), visual (V), and common proper motion (C) ranges. The size of the circles roughly scale with the stellar mass. Green thick lines mark separation intervals that have not been investigated and might harbour additional hierarchical levels.
Current usage metrics show cumulative count of Article Views (full-text article views including HTML views, PDF and ePub downloads, according to the available data) and Abstracts Views on Vision4Press platform.
Data correspond to usage on the plateform after 2015. The current usage metrics is available 48-96 hours after online publication and is updated daily on week days.
Initial download of the metrics may take a while.