Free Access
Fig. 1
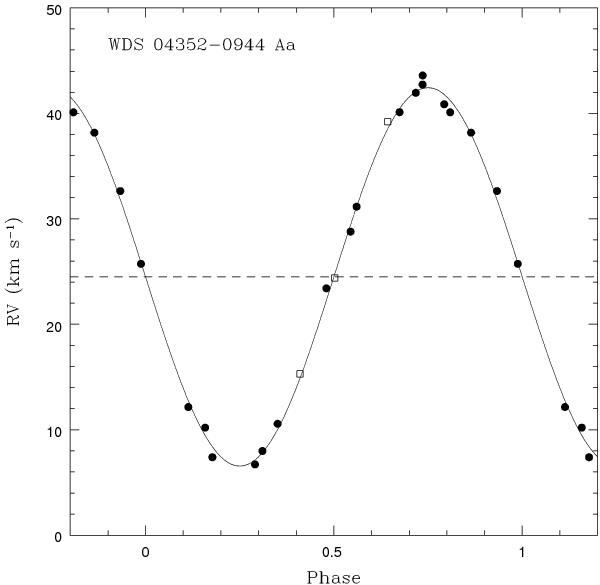
Radial velocity curve of WDS 04352–0944 Aa. Filled circles and empty squares represent our data and the velocities measured by NA85, respectively. Continuous line shows the orbital fitting. Dashed line indicates the barycentre’s velocity.
Current usage metrics show cumulative count of Article Views (full-text article views including HTML views, PDF and ePub downloads, according to the available data) and Abstracts Views on Vision4Press platform.
Data correspond to usage on the plateform after 2015. The current usage metrics is available 48-96 hours after online publication and is updated daily on week days.
Initial download of the metrics may take a while.