Fig. 10
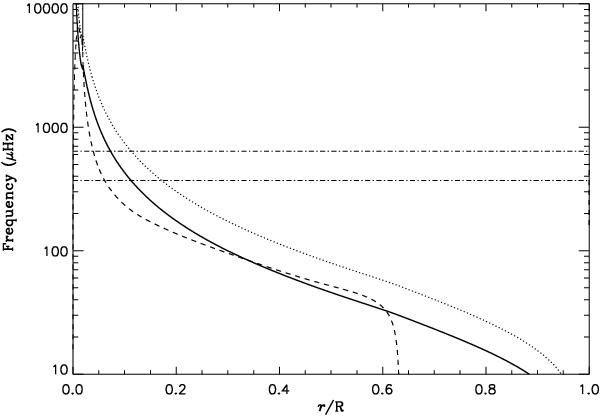
Propagation diagram computed using the best fitting ASTEC model. The dashed line represents the Brunt-Väisälä frequency. The continuous and dotted lines are the Lamb frequencies for the ℓ = 1 and 2 modes, respectively. The horizontal dot-dashed lines represent the frequency range in which the modes were detected.
Current usage metrics show cumulative count of Article Views (full-text article views including HTML views, PDF and ePub downloads, according to the available data) and Abstracts Views on Vision4Press platform.
Data correspond to usage on the plateform after 2015. The current usage metrics is available 48-96 hours after online publication and is updated daily on week days.
Initial download of the metrics may take a while.