Fig. 9
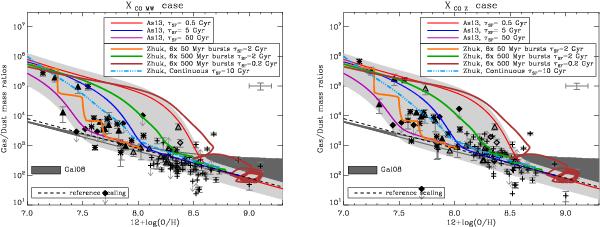
G/D as a function of metallicity for the 2 values of XCO: XCO,MW (left) and XCO,Z (right) with the three chemical evolution model considered in Sect. 4. The symbols are the same as for Fig. 4. The model ranges from Galliano et al. (2008) are delineated by the dark grey stripe. The models from Asano et al. (2013a) are shown with the red, blue and purple lines and the light grey tolerance zone. The models from Zhukovska (2014) are shown with the orange, green brown solid lines and cyan dash-3 dots line. The black dashed line represents the reference scaling of the G/D with metallicity (not fit to the data).
Current usage metrics show cumulative count of Article Views (full-text article views including HTML views, PDF and ePub downloads, according to the available data) and Abstracts Views on Vision4Press platform.
Data correspond to usage on the plateform after 2015. The current usage metrics is available 48-96 hours after online publication and is updated daily on week days.
Initial download of the metrics may take a while.