Fig. 6
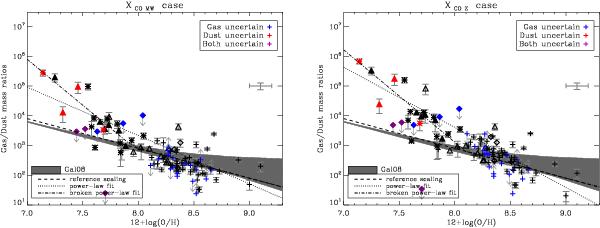
G/D as a function of metallicity for the 2 values of XCO: XCO,MW (left) and XCO,Z (right) with the chemical evolution model of Galliano et al. (2008). The colours and symbols are the same as for Fig.4. The dark grey stripes show the range of values from the Galliano et al. (2008) chemical evolution model. The black dashed line represents the reference scaling of the G/D with metallicity (not fit to the data). The black dotted and dash-dotted lines represent the best power-law and best broken power-law fits to the data.
Current usage metrics show cumulative count of Article Views (full-text article views including HTML views, PDF and ePub downloads, according to the available data) and Abstracts Views on Vision4Press platform.
Data correspond to usage on the plateform after 2015. The current usage metrics is available 48-96 hours after online publication and is updated daily on week days.
Initial download of the metrics may take a while.