Fig. 4
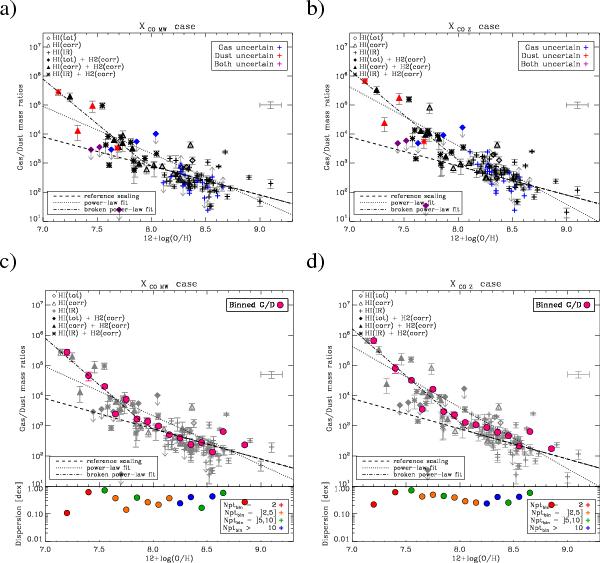
Top row: G/D as a function of metallicity for the 2 values of XCO: XCO,MWa) and XCO,Zb). The mean error for the data points is shown in grey on the right of the plots. The colours code the reliability of the point depending whether the gas mass is uncertain (in blue), the dust mass is uncertain (in red) or if both are uncertain (in purple). The symbol traces the changes made in the Hi and H2 masses (see text for details on the uncertainties and the changes on the gas masses). The dashed line represents the reference scaling of the G/D with metallicity (not fit to the data). The dotted and dash-dotted lines represent the best power-law and best broken power-law fits to the data. Bottom row: same as top row for XCO,MWc) and XCO,Zd), where the binned G/D values (see text) have been added as pink filled circles. For clarity, the observed G/D values are now shown in grey. On the bottom panels the relative dispersion in each bins, in terms of standard deviation, is shown and the colours show the number of galaxies in each bin.
Current usage metrics show cumulative count of Article Views (full-text article views including HTML views, PDF and ePub downloads, according to the available data) and Abstracts Views on Vision4Press platform.
Data correspond to usage on the plateform after 2015. The current usage metrics is available 48-96 hours after online publication and is updated daily on week days.
Initial download of the metrics may take a while.