Fig. 3
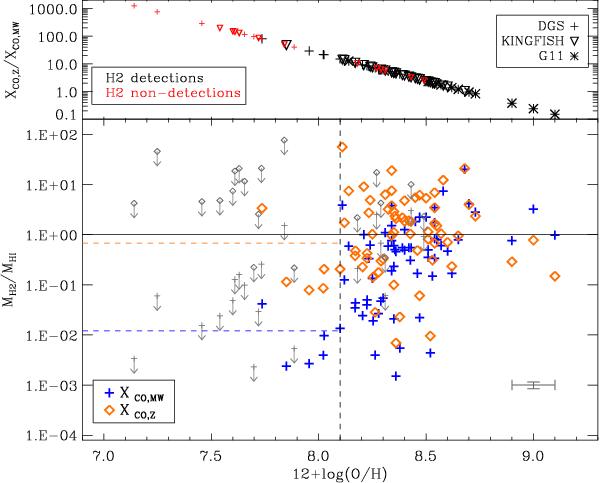
Bottom: M H2 /MHI as a function of metallicity for the whole sample. The blue crosses are for molecular gas masses computed with XCO,MW and the orange diamonds are for molecular gas masses computed with XCO,Z. Upper limits in the molecular gas mass are indicated with grey arrows and smaller grey symbols. The mean error for the data points is shown in grey on the bottom right of the plot. The plain line shows the unity line. The dashed blue and orange lines show the 1.2% and 68% molecular-to-atomic gas mass fractions respectively and represent the mean H2-to-Hi ratio of the detected galaxies with 12 + log(O/H)< 8.1 (see text). The horizontal dashed black line shows the metallicity threshold 12 + log(O/H)= 8.1 to guide the eye. Top: XCO,Z/XCO,MW illustrating the (O/H)-2 dependence adopted to compute XCO,Z. The symbols delineate between the three samples: crosses, downward triangles and stars for the DGS, KINGFISH and G11 samples respectively. The colours differentiate between H2 detections (in black, corresponding to the coloured points on the bottom panel) and the H2 non-detections (in red, corresponding to the grey points in the bottom panel).
Current usage metrics show cumulative count of Article Views (full-text article views including HTML views, PDF and ePub downloads, according to the available data) and Abstracts Views on Vision4Press platform.
Data correspond to usage on the plateform after 2015. The current usage metrics is available 48-96 hours after online publication and is updated daily on week days.
Initial download of the metrics may take a while.