Fig. 1
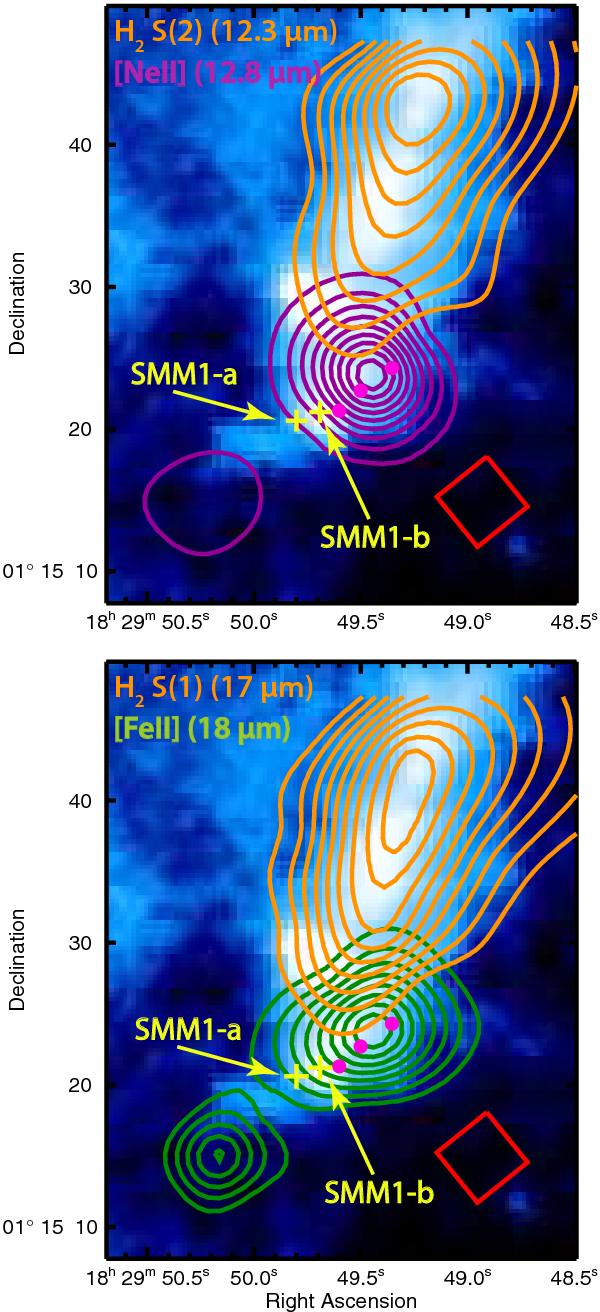
Emission line maps of the [NeII]  –
– and
H2 S(2) lines
(top panel) and the [Fe II]
and
H2 S(2) lines
(top panel) and the [Fe II]  –
– and
H2 S(1) lines
(lower panel). On both panels line emission is superimposed on an
IRAC band-2 (4.5 μm) image. The positions of SMM1-a and SMM1-b (to
the SE and NW, with respect to each other) from Choi
(2009) are marked with crosses, and the SH spaxel size and orientation is
marked as a (red) square in the lower right corner of each panel. The (magenta) filled
circles show the positions of the 163 GHz H2O maser emission (van Kempen et al. 2009), coincident with the NW lobe of the atomic emission.
Contour levels are at 10–90% of the peak emission for each transition, as listed in
Table 1.
and
H2 S(1) lines
(lower panel). On both panels line emission is superimposed on an
IRAC band-2 (4.5 μm) image. The positions of SMM1-a and SMM1-b (to
the SE and NW, with respect to each other) from Choi
(2009) are marked with crosses, and the SH spaxel size and orientation is
marked as a (red) square in the lower right corner of each panel. The (magenta) filled
circles show the positions of the 163 GHz H2O maser emission (van Kempen et al. 2009), coincident with the NW lobe of the atomic emission.
Contour levels are at 10–90% of the peak emission for each transition, as listed in
Table 1.
Current usage metrics show cumulative count of Article Views (full-text article views including HTML views, PDF and ePub downloads, according to the available data) and Abstracts Views on Vision4Press platform.
Data correspond to usage on the plateform after 2015. The current usage metrics is available 48-96 hours after online publication and is updated daily on week days.
Initial download of the metrics may take a while.