Fig. 8
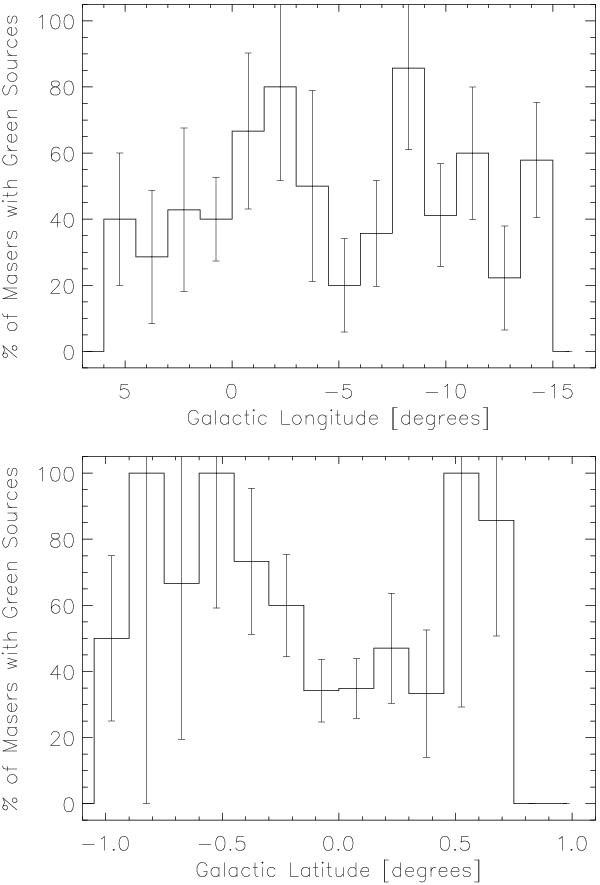
Top: histogram of the percentage of 6.7 GHz masers associated with
green sources as a function of Galactic longitude. Bottom:
histogram of the percentage of 6.7 GHz masers associated with green sources as a
function of Galactic latiitude. The bin size is 0.15°. Errors for the detection rates in
both histograms are calculated using  counting statistics.
Current usage metrics show cumulative count of Article Views (full-text article views including HTML views, PDF and ePub downloads, according to the available data) and Abstracts Views on Vision4Press platform.
Data correspond to usage on the plateform after 2015. The current usage metrics is available 48-96 hours after online publication and is updated daily on week days.
Initial download of the metrics may take a while.