Fig. 4
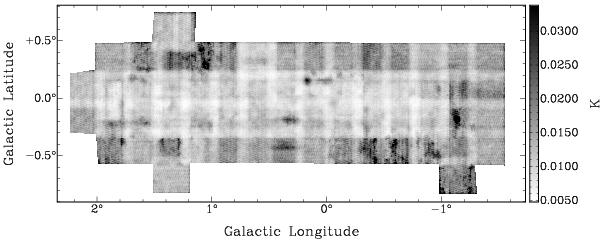
Noise in the spectrum at each position in the Mopra data cube. Because of the uneven noise throughout the data, we divide the original data cube by this 2D image, resulting in a signal-to-noise data cube. The grayscale bar on the right shows the noise temperature in units of K (the conversion to Jy is 12.3 Jy/K).
Current usage metrics show cumulative count of Article Views (full-text article views including HTML views, PDF and ePub downloads, according to the available data) and Abstracts Views on Vision4Press platform.
Data correspond to usage on the plateform after 2015. The current usage metrics is available 48-96 hours after online publication and is updated daily on week days.
Initial download of the metrics may take a while.