Fig. 11
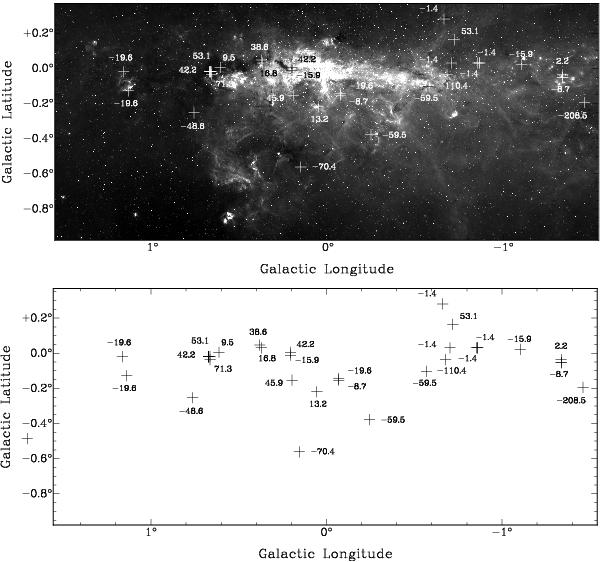
Top: Spitzer/IRAC 8 μm image of the Galactic center region. Crosses (+) indicate the positions of the H2O masers identified in the Mopra survey. Each maser is labelled with the velocity (in km s-1) of the peak maser emission. Bottom: same as the top figure, but with a blank background instead of the 8 μm image.
Current usage metrics show cumulative count of Article Views (full-text article views including HTML views, PDF and ePub downloads, according to the available data) and Abstracts Views on Vision4Press platform.
Data correspond to usage on the plateform after 2015. The current usage metrics is available 48-96 hours after online publication and is updated daily on week days.
Initial download of the metrics may take a while.