Fig. 9
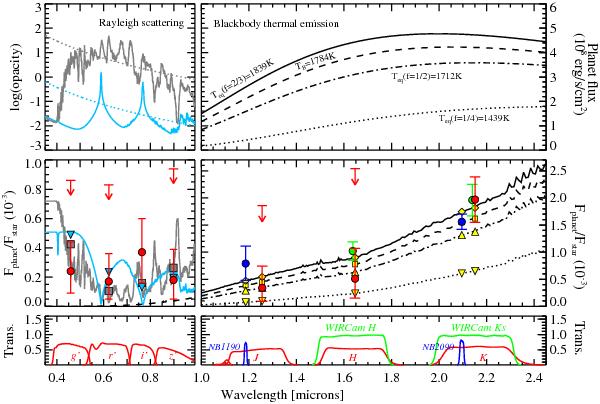
Dayside model spectra compared to the observed occultation depths. In the top panels, the left one displays the relative contributions of absorption (solid curves) and Rayleigh scattering (dotted lines). Two models of different opacity sources (TiO/VO in gray vs. Na/K in skyblue) are shown. The top right panel displays blackbody planetary dayside thermal emission spectra, with temperatures of 1784 K, 1439 K, 1712 K, and 1839 K, corresponding to the 2.09 μm brightness temperature TB and equilibrium temperatures Teq of three different heat redistribution factors. Middle panels show the planet-star flux ratios calculated based on the top panels. Our seven-band measurements are shown in red circles with error bars or arrows (3σ upper limit). Another two narrow-band measurements from VLT/HAWK-I (Gillon et al. 2012) and two broad-band measurements from CFHT/WIRCam (Wang et al. 2013) are shown with blue and green circles, respectively. Bandpass-integrated model values are plotted in symbols without error bars. Bottom panels show the filter transmission curves. See detailed discussion in Sect. 4.3.2.
Current usage metrics show cumulative count of Article Views (full-text article views including HTML views, PDF and ePub downloads, according to the available data) and Abstracts Views on Vision4Press platform.
Data correspond to usage on the plateform after 2015. The current usage metrics is available 48-96 hours after online publication and is updated daily on week days.
Initial download of the metrics may take a while.