Fig. 8
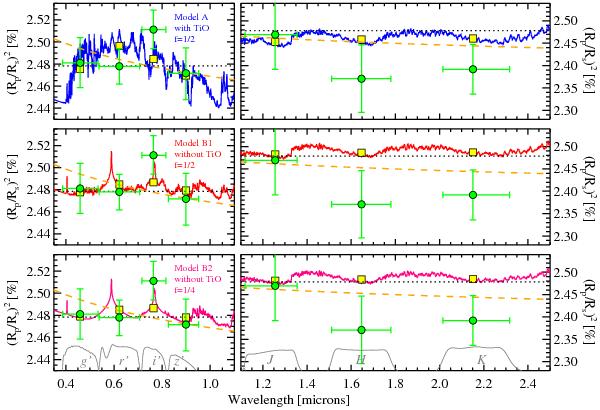
Model transmission spectra compared to observed transit depths which are derived
from a single transit. In all panels, green circles with error bars show our
measurements in the g′r′i′z′JHK
bands, of which the horizontal error bars indicate the FWHM of each bandpass.
Black dotted line shows a constant value of
 . Orange dashed line shows a
Rayleigh scattering spectrum that is caused by a high-altitude haze. Three
fiducial model spectra are shown for comparison, and their broad-band integrated
values are displayed in yellow squares. The optical and NIR data are shown in
separate panels with different scales for clarity. Top panels
show a model with TiO/VO as the dominant opacity sources and a
dayside-wide averaged (f = 1/2) pressure-temperature (P-T)
profile. Middle and bottom panels show two
models with Na and K as the dominant opacity sources. While the middle-panel model
has a dayside-wide averaged P-T profile, the bottom-panel model has a planet-wide
averaged P-T profile (f = 1/4). See Sect. 4.3.1 for detailed discussion.
. Orange dashed line shows a
Rayleigh scattering spectrum that is caused by a high-altitude haze. Three
fiducial model spectra are shown for comparison, and their broad-band integrated
values are displayed in yellow squares. The optical and NIR data are shown in
separate panels with different scales for clarity. Top panels
show a model with TiO/VO as the dominant opacity sources and a
dayside-wide averaged (f = 1/2) pressure-temperature (P-T)
profile. Middle and bottom panels show two
models with Na and K as the dominant opacity sources. While the middle-panel model
has a dayside-wide averaged P-T profile, the bottom-panel model has a planet-wide
averaged P-T profile (f = 1/4). See Sect. 4.3.1 for detailed discussion.
Current usage metrics show cumulative count of Article Views (full-text article views including HTML views, PDF and ePub downloads, according to the available data) and Abstracts Views on Vision4Press platform.
Data correspond to usage on the plateform after 2015. The current usage metrics is available 48-96 hours after online publication and is updated daily on week days.
Initial download of the metrics may take a while.