Fig. 6
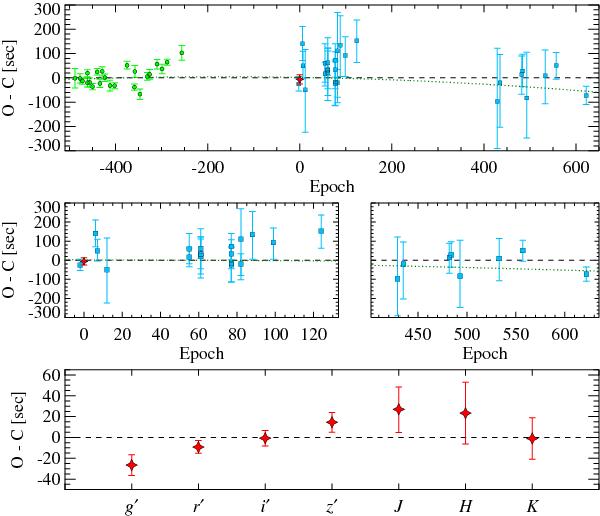
Transit timing O–C residuals for WASP-43b. In the top panel, green circles show timings from Gillon et al. (2012) (with epoch less than –200), blue squares show timings from TRESCA (with epoch longer than –10, see Sect. 3.4 for the reanalysis process), while red star shows our weighted average timing value (at epoch 0), where the error bar indicates the standard deviation of our seven filters. Middle panels: a zoom-in view of the transit timings obtained after epoch –10. Bottom panel: our seven-filter timings. The dashed line refers to the linear regression, while the dotted line represents a quadratic fit.
Current usage metrics show cumulative count of Article Views (full-text article views including HTML views, PDF and ePub downloads, according to the available data) and Abstracts Views on Vision4Press platform.
Data correspond to usage on the plateform after 2015. The current usage metrics is available 48-96 hours after online publication and is updated daily on week days.
Initial download of the metrics may take a while.