Free Access
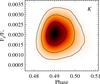
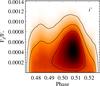
Fig. 5
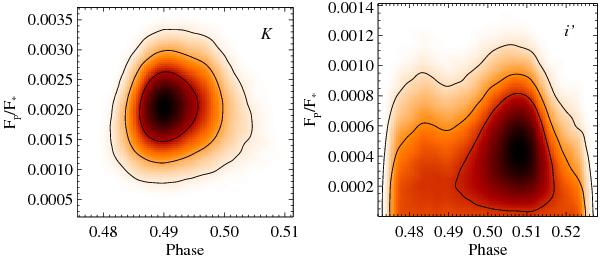
Correlation between mid-occultation time (converted to phase for display purpose) and flux ratio for the K- and i′-bands derived from the MCMC analysis. Three contour levels indicate the 68.3% (1σ), 95.4% (2σ), and 99.7% (3σ) confidence levels, respectively.
This figure is made of several images, please see below:
Current usage metrics show cumulative count of Article Views (full-text article views including HTML views, PDF and ePub downloads, according to the available data) and Abstracts Views on Vision4Press platform.
Data correspond to usage on the plateform after 2015. The current usage metrics is available 48-96 hours after online publication and is updated daily on week days.
Initial download of the metrics may take a while.