Fig. 3
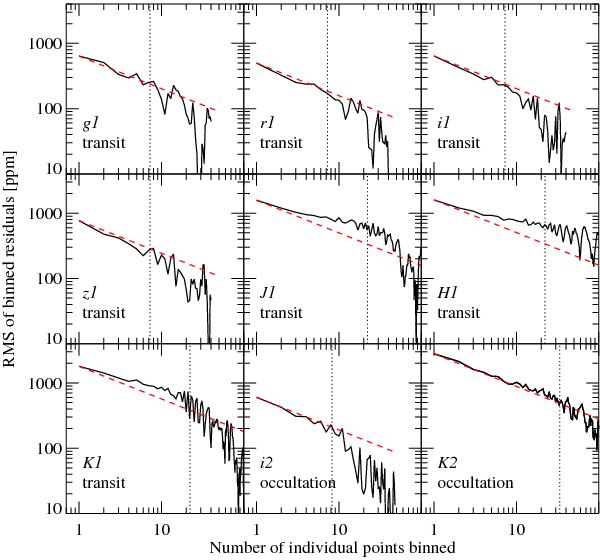
Standard deviation of light-curve O–C residuals binned in different time resolutions, showing the level of time-correlated noise. Red dashed line indicates the expected Poisson-like noise, i.e., standard deviation of unbinned O–C residuals over square-root of N. Vertical dotted line shows corresponding ingress/egress duration. The number following the filter name indicates either primary transit (1) or occultation (2).
Current usage metrics show cumulative count of Article Views (full-text article views including HTML views, PDF and ePub downloads, according to the available data) and Abstracts Views on Vision4Press platform.
Data correspond to usage on the plateform after 2015. The current usage metrics is available 48-96 hours after online publication and is updated daily on week days.
Initial download of the metrics may take a while.