Fig. 1
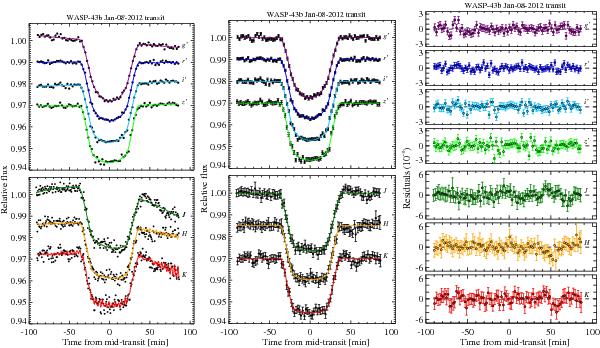
Primary transit light curves of WASP-43b as observed with the GROND instrument mounted on the ESO/MPG 2.2 m telescope. In each panel, transit light curves of g′r′i′z′JHK are shown from top to bottom. Left panel shows light curves that are normalized by the reference stars. Middle panel shows baseline-corrected light curves that are binned every 2 min for display purposes (see Sect. 3.1 for baseline correction). Right panels show the best-fit light-curve residuals, also binned every 2 min. Best-fit models for all panels are overlaid in solid or dashed lines.
Current usage metrics show cumulative count of Article Views (full-text article views including HTML views, PDF and ePub downloads, according to the available data) and Abstracts Views on Vision4Press platform.
Data correspond to usage on the plateform after 2015. The current usage metrics is available 48-96 hours after online publication and is updated daily on week days.
Initial download of the metrics may take a while.