Fig. 2
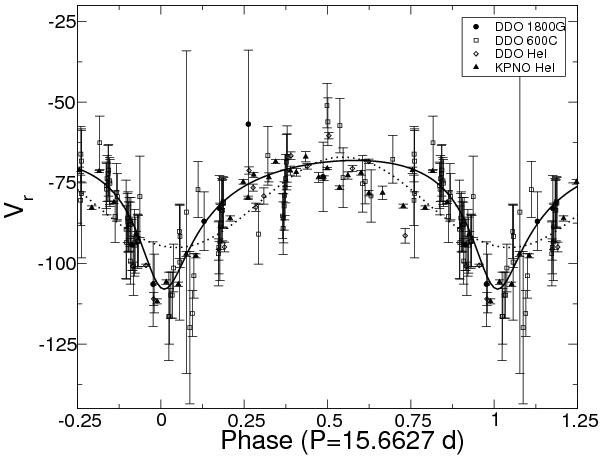
Radial velocity curve of BD +60 73. Observations corresponding to the various instrument configurations are indicated by the symbols listed in the key and shown with their 1σ uncertainties. The best-fit theoretical curve is shown as the solid line, while the best-fit circular orbit is shown as the dashed line. Phase 0.0 corresponds to periastron.
Current usage metrics show cumulative count of Article Views (full-text article views including HTML views, PDF and ePub downloads, according to the available data) and Abstracts Views on Vision4Press platform.
Data correspond to usage on the plateform after 2015. The current usage metrics is available 48-96 hours after online publication and is updated daily on week days.
Initial download of the metrics may take a while.