Fig. 3
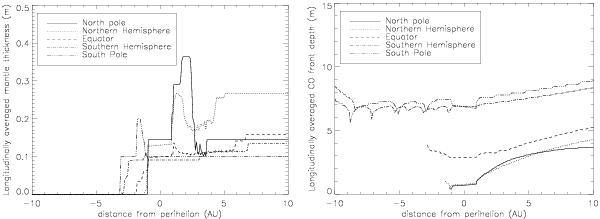
Left: Longitudinally averaged mantle thickness of the reference simulation case against distance from perihelion for five latitudinal bands. Right: Analogous plot of longitudinally averaged carbon monoxide front depth. In these plots, negative distances represent values pre-perihelion.
Current usage metrics show cumulative count of Article Views (full-text article views including HTML views, PDF and ePub downloads, according to the available data) and Abstracts Views on Vision4Press platform.
Data correspond to usage on the plateform after 2015. The current usage metrics is available 48-96 hours after online publication and is updated daily on week days.
Initial download of the metrics may take a while.