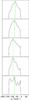
Fig. 5
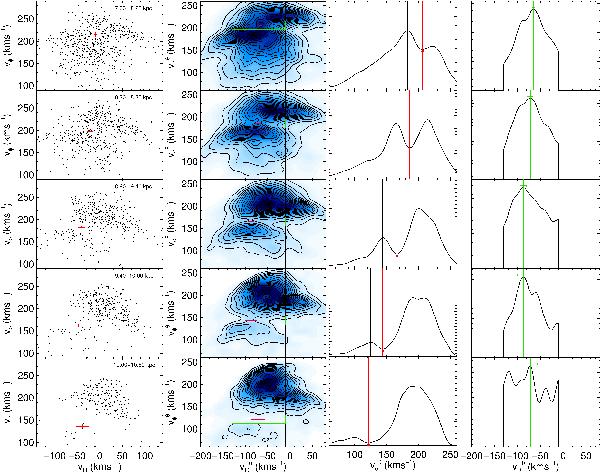
Illustration of the steps followed to locate the saddle point vφ,OLR for the band at 40 deg. First column: scatter plot of the velocities in bins in radius as indicated in the top right part of the panels. The red cross in these panels shows our determination of the saddle point. Second column: velocity distribution computed with the kernel adaptive method after a rotation of coordinates by an angle θ = 15 deg. Third column: distribution of  inside the region limited by black vertical lines shown in the second column. The red vertical line and red error bar show the position of the minimum corresponding to the velocity of the saddle point and its error ebst. The black vertical line indicates the Hercules peak. Fourth column: distribution in
  inside the green rectangle shown in the second column. The green vertical line and green error bar shows the position of the maximum which corresponds to the
  velocity of the saddle point and its error ebst.
Current usage metrics show cumulative count of Article Views (full-text article views including HTML views, PDF and ePub downloads, according to the available data) and Abstracts Views on Vision4Press platform.
Data correspond to usage on the plateform after 2015. The current usage metrics is available 48-96 hours after online publication and is updated daily on week days.
Initial download of the metrics may take a while.