Fig. 12
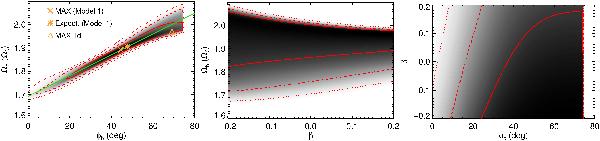
Two-dimensional marginalised likelihoods (over the 3rd parameter) for the model parameters for the RAVE data. Solid, dashed and dotted red lines show the 1σ, 2σ and 3σ confidence regions, respectively. In the left panel the maximum and the expected value of the two-dimensional pdf are indicated with a orange cross and asterisk, respectively. The orange triangle is the maximum of the one-dimensional marginalised pdf’s.
Current usage metrics show cumulative count of Article Views (full-text article views including HTML views, PDF and ePub downloads, according to the available data) and Abstracts Views on Vision4Press platform.
Data correspond to usage on the plateform after 2015. The current usage metrics is available 48-96 hours after online publication and is updated daily on week days.
Initial download of the metrics may take a while.