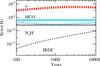
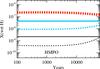
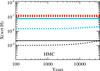
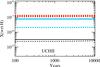
Fig. 7
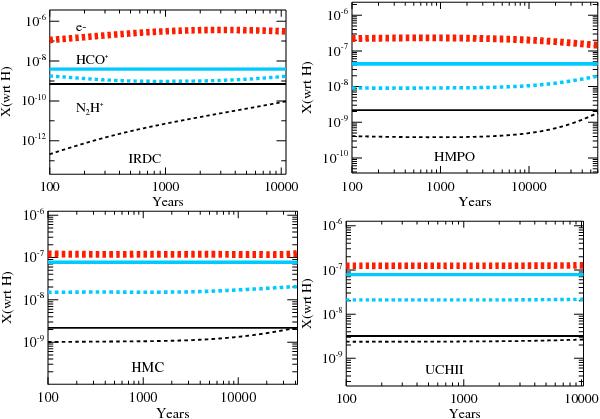
Averaged relative abundances to H2 for electrons, HCO+, and N2H+ plotted for the all four stages. The observed values are shown as solid lines, the modeled values are depicted as dashed lines. The electron abundances are plotted in red, N2H+ abundances in black, and HCO+ abundances in blue. The error bars for both the model and the observational data are a factor of about 3 (not shown).
Current usage metrics show cumulative count of Article Views (full-text article views including HTML views, PDF and ePub downloads, according to the available data) and Abstracts Views on Vision4Press platform.
Data correspond to usage on the plateform after 2015. The current usage metrics is available 48-96 hours after online publication and is updated daily on week days.
Initial download of the metrics may take a while.