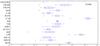
Fig. 3
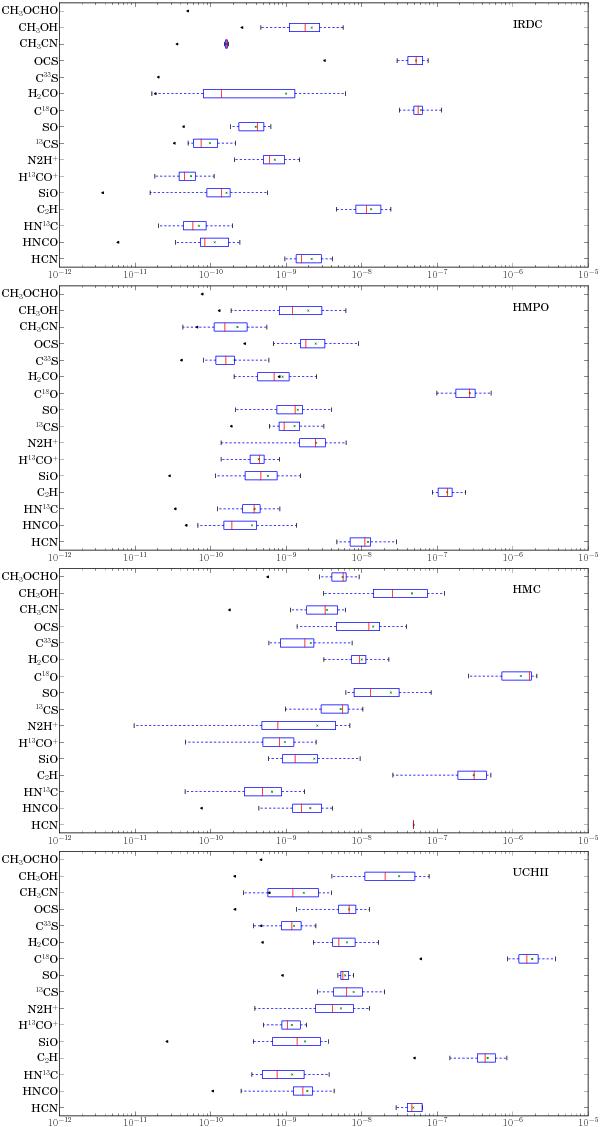
From top to bottom abundances (with respect to the total H2) of the analyzed molecules in the IRDC, HMPO, HMC and UCHii sample. The red line shows the median, the green cross is the mean, the bar indicates the inner 25%−75% range around the median and the whiskers mark the total range of all detections. The black arrows indicate the lowest upper limit of all calculated upper limits for this particular molecule and stage.
Current usage metrics show cumulative count of Article Views (full-text article views including HTML views, PDF and ePub downloads, according to the available data) and Abstracts Views on Vision4Press platform.
Data correspond to usage on the plateform after 2015. The current usage metrics is available 48-96 hours after online publication and is updated daily on week days.
Initial download of the metrics may take a while.