Free Access
Fig. 2
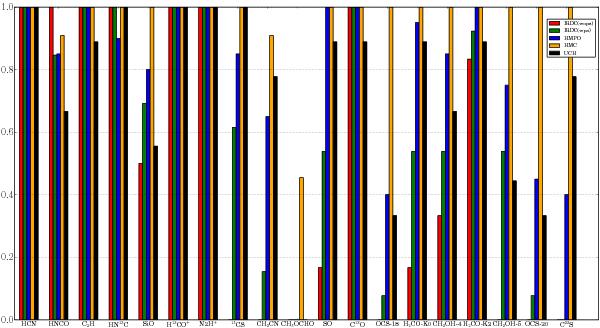
Relative detection fractions for each analyzed molecular transition ordered from left to right: IRDCs without associated point sources at wavelengths below 70 μm, IRDCs with associated point sources, HMPOs, HMCs, and UCHiis. The color notation for the different source types is explained in the upper right corner.
Current usage metrics show cumulative count of Article Views (full-text article views including HTML views, PDF and ePub downloads, according to the available data) and Abstracts Views on Vision4Press platform.
Data correspond to usage on the plateform after 2015. The current usage metrics is available 48-96 hours after online publication and is updated daily on week days.
Initial download of the metrics may take a while.