Fig. 9
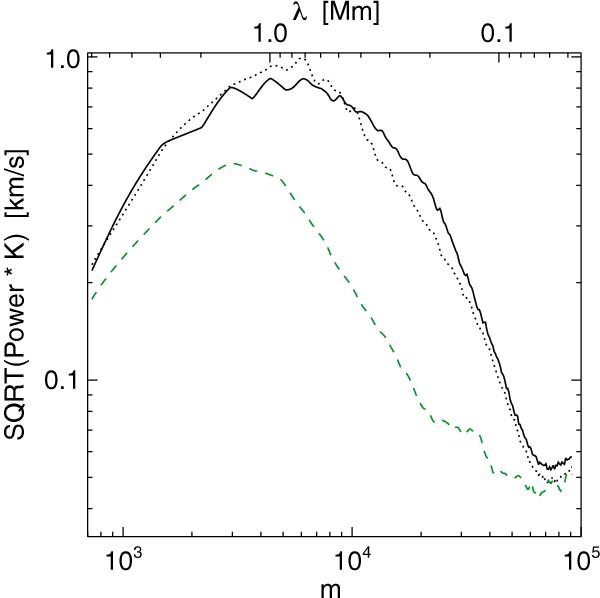
Velocity spectra for the horizontal velocities. Dashed green: spectrum corresponding to the horizontal velocity determined via LCT on continuum maps in the synthetic observations obtained from the MHD 100 G simulation run. No instrumental degradation is applied to the synthetic observations. Solid black: spectrum for the horizontal component of the velocity taken directly from the MHD 100 G data cube on the log (τ500) = 0 surface. No p-mode filtering has been applied. The vertical velocity spectra from the synthetic observations (taken from Fig. 8) is plotted for comparison (dotted black line).
Current usage metrics show cumulative count of Article Views (full-text article views including HTML views, PDF and ePub downloads, according to the available data) and Abstracts Views on Vision4Press platform.
Data correspond to usage on the plateform after 2015. The current usage metrics is available 48-96 hours after online publication and is updated daily on week days.
Initial download of the metrics may take a while.